These produce plots to assess the
quality of a
fit. There many possible
forms for the plots, and in fact two possible residuals windows:
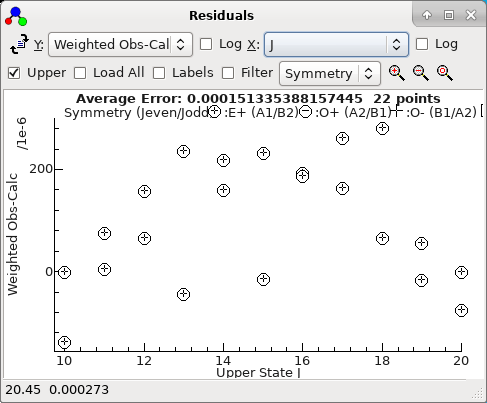
- The standard residuals window, where the observed and
calculated values from the current fit are plotted. This is
appropriate for all fits.
- The intensity residuals window, where the observed and
calculated values are always intensities of the fitted lines,
even if the current fit is not to intensities. This requires
intensity information to be present in the fit input, and is
particularly suitable for Automatic
Fitting.
These will normally appear automatically when relevant, but can be
shown with "
View","
Residuals" and "
View","
Intensity
Residuals". The default residuals window will look
something like this:
The status bar displays the
x,
y
co-ordinates of the mouse and, if the mouse is over an
experimental point, the source of the data point. Right click on
the point for various options for working on observations; see
below for a list. If you select an area with a mouse additional
options applying to the points inside or outside the area are
available.
If
PGOPHER is correctly configured, you can go directly
to the source of the data by right clicking on a given point and
selecting "Edit Point" - see below for other options.
For the formulae below,
oi is the
ith
observation,
ci the corresponding calculated
value,
pi is a population and
wi
the weight. The population,
pi, is the
calculated population of the upper or lower state, depending on
the setting of the
Upper check box.
The average error displayed at the top is simply [Σ[(
oi-
ci)/
wi]
2/
nobs]
½, which
is slightly different to the value given in fits as it does not
take account of the number of parameters floated. (This allows a
value to be calculated without doing a fit.)
To bring up this menu right click on the point(s) of interest
Draw a box with the mouse before right clicking to operate on
multiple points.
 Windows